
Last updated
17 January 2025
Overview
The Instant feedback feature allows you to perform real-time data analysis through surveys, providing valuable insights for your property. The Stats section (CMS > Feedback > Statistics) enables you to analyze customer satisfaction at different levels to support decision-making and take action if needed.
Before getting started
Before using survey statistics, ensure you:
- Know the types of surveys available: Welcome, Generic, Facilities & Services, and Checkout.
- Have a clear date range for the data you want to analyze.
- Understand the categories of data provided: average scores, users, and specific services.
Step-by-step guide
Step 1: Access the statistics overview
- Navigate to CMS > Feedback > Statistics > Overview.
- Set the desired date range:
- Click the date field to open the calendar and select the range.
- If no range is selected, the last month is displayed by default.
- Review the data presented in three blocks:
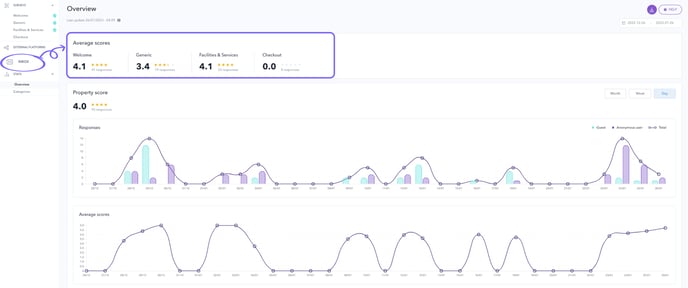
- Average scores: Displays average survey scores for each type of survey.
- Users: Provides insights into survey responses based on user type (logged users vs. non-logged users) and response channels.
- Specific services: Highlights data for facilities or services with existing surveys.
Step 2: Analyze average scores
- Locate the Average scores block in the Overview section.
- Review the average scores for each survey type: Welcome, Generic, Facilities & Services, and Checkout.
- Each score is calculated by dividing the sum of all response scores by the total number of responses received.
- Example: If the Welcome survey received 250 responses last month, the average score is calculated as the total of all scores divided by 250.
Step 3: Examine user data
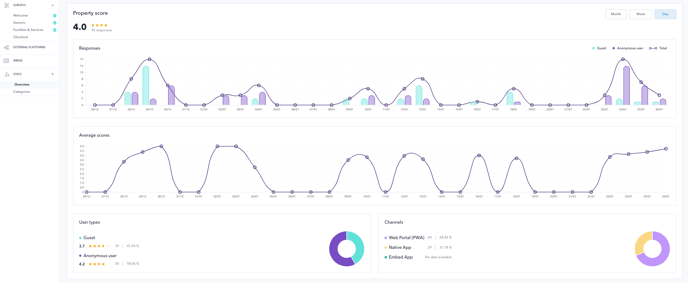
- In the Users block, check the overall average score given by all users (logged and non-logged users).
- Analyze the following graphs:
- Responses: Shows the number of responses by user type (green for logged users, purple for non-logged users).
- Average scores: This graph shows the average score of all users and all surveys by date.
- User types: Illustrates the proportion of logged and non-logged users responding to surveys.
- Channels: Indicates the channels through which users responded (web portal, native app, embedded app).
- Adjust the time frame (day, week, or month) for the Responses and Average scores graphs using the buttons at the top-right corner of the block.
Step 4: Review specific service statistics
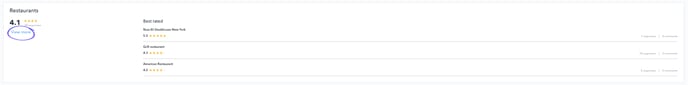
- Scroll to see additional data for services with existing surveys (e.g., Spa, Buffet Restaurant).
- Click View more below a service’s average score to access detailed analysis for that service.
-
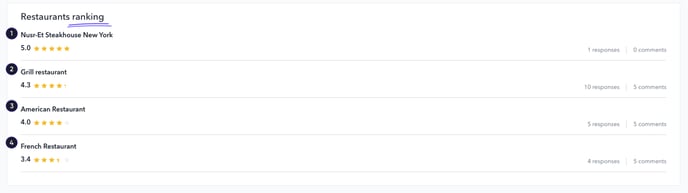
- Average scores and user data specific to the service.
- Rankings of the best-valued services.
- Total number of responses and comments for each service.
Step 5: Export statistical reports
- Click the Download report button at the top-right corner of the screen, next to the date field.
- A report will be downloaded in spreadsheet format (.xlsx), allowing further analysis of the results.
Next steps
Use the insights from the statistics to identify trends, understand guest satisfaction, and pinpoint areas for improvement. If needed, explore the Inbox section for a deeper dive into individual survey responses.
Need further assistance?
If you have additional questions or require further assistance:
- Contact us via live chat
- Send a ticket to our Support team
- Visit STAY Academy